The short version
Problem
Plans to build on the Moon by heating its soil lean on data from simulants melted in Earth’s air, and air changes the iron. No published work appears to say how much that matters, soil by soil.
What I built
A pipeline trained on about 14,000 melt measurements, checked against published studies, stress tested on controlled oxygen experiments, run on 66 real Moon soils.
Result
Fully molten, Earth data is fine. Where sintering happens, iron rich soils soften 5 to 32 K lower on the Moon, and no current model, mine included, reliably gets that direction right.
QuizBefore anything, make a call
Take a melt of Moon soil, cooled until it is nearly glass, which is where sintering happens. Swap its Earth lab iron (about 60% oxidized, as Fe3+) for real lunar iron (about 2%). At the same temperature, it gets:
How often each model gets that direction right, one dot per measured series:
The ones that get the direction right still miss the size. The rest of this page is how I found that out.
01Why melt the Moon at all?
what I was thinking Every pound launched to the Moon is expensive. The soil is already there. If you are going to build with it by heating it, the property that runs the whole process is how easily it flows.
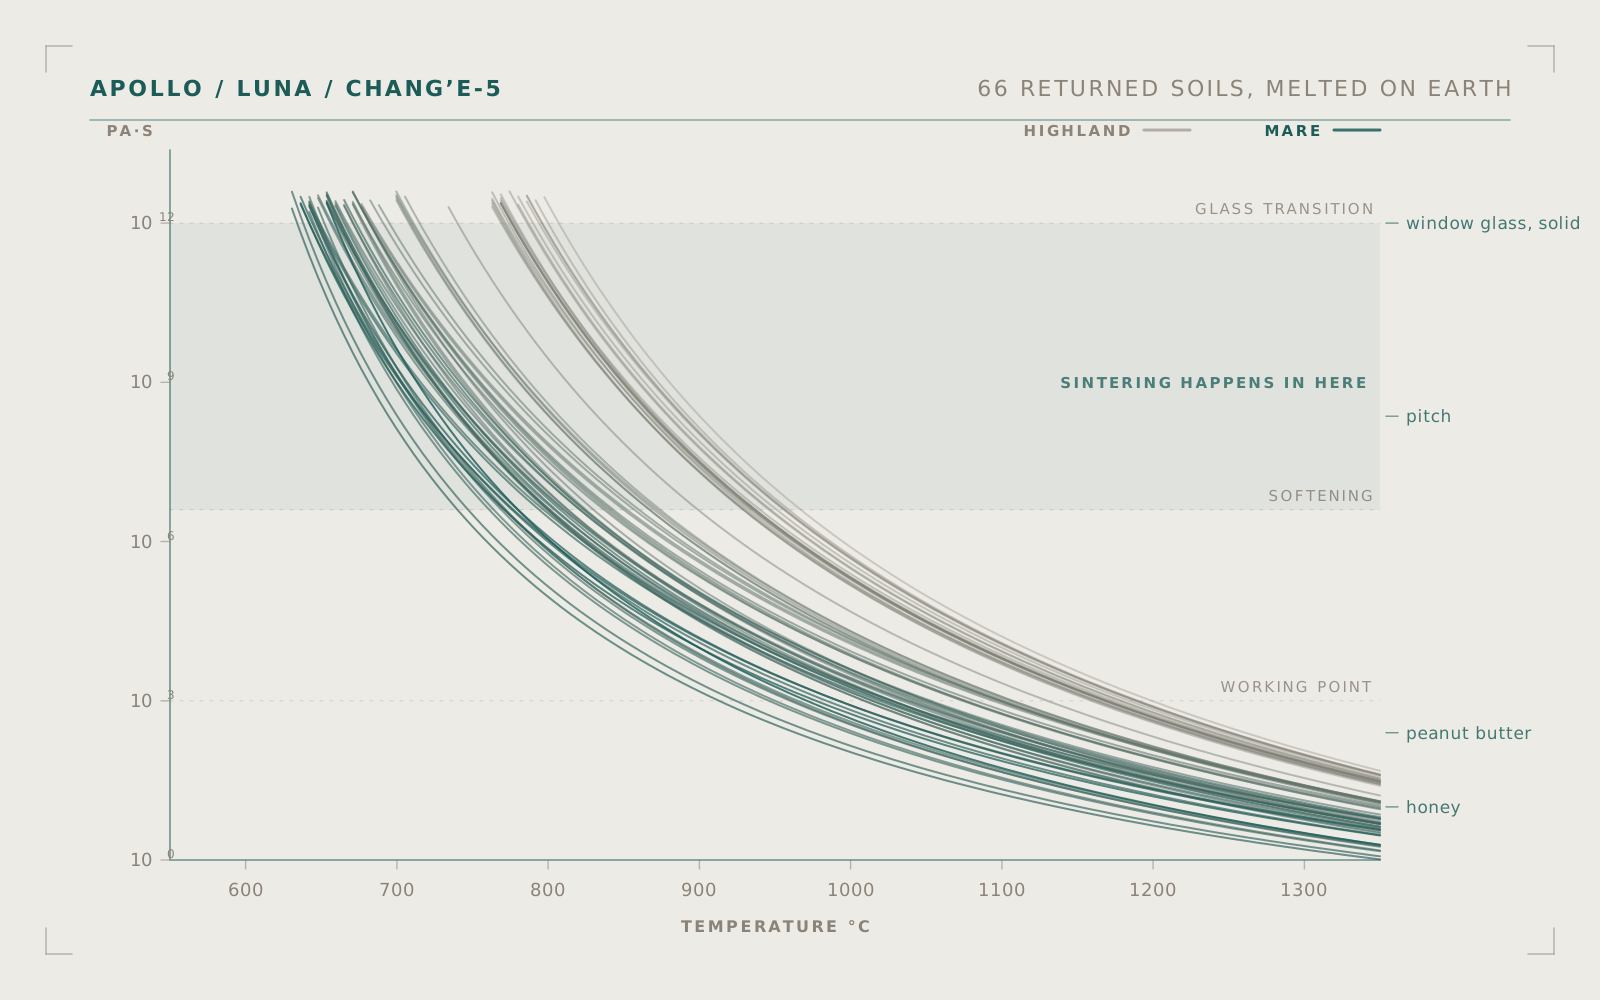
There are two ways to build with hot soil. Melt processing (melt extrusion, or molten regolith electrolysis for oxygen) works with fully liquid rock. Sintering heats powder just until the grains soften and fuse, and it is the leading way to build at scale. Both run on viscosity, how thick the melt is, measured in Pa·s:
- 1012Glass transition. Window glass counts as a solid from here up.
- Sintering works in here
- 106.6Softening point
- 103Working point. Melt processing works below it.
- ~250Peanut butter
- ~10Honey
Molten rock climbs that whole ladder in a few hundred degrees.
02The catch: Earth air changes the iron
What I was thinking: Almost all of this data comes from simulant soil melted in a furnace in air. Air oxidizes iron. The Moon has essentially no oxygen. Is everyone measuring a slightly different material than the one they will actually process?
Iron’s state changes how the melt’s silicate network links up, which changes viscosity. So: for each real Moon soil, how far do the key processing temperatures shift between an Earth test and the Moon?
The fine print
The 60% is from the 2025 Stapperfend simulant studies. Lunar soil formed below the iron-wüstite buffer (written IW−1 on this page), where nearly all iron is Fe2+.
03Design the test before the model
What I was thinking: If the shift is small when fully molten and large near the glass transition, then the interesting part is sintering. Aim there, and design the test before the model.
Written down before any training:
1 Train
13,981
water free melt measurements from the open gpvisc database
2 Hold out
16
lunar simulant melts from two 2025 papers, unlike anything in training
3 Stress test
7
controlled oxygen series, iron state measured by titration
4 Apply
66
returned Apollo, Luna and Chang’e-5 soils
The model itself is not new, and I said so in the brief. What is new is the question: nobody appears to have mapped Earth vs Moon processing windows, with uncertainty, before.
How the model works
About 12 oxide fractions go in, with iron split into FeO and Fe2O3 by a redox model at air or at IW−1. Out come the three parameters of the standard Vogel-Fulcher-Tammann equation, log η = A + B / (T − C), so temperature only ever enters through the physics. A deep ensemble of ten networks gives the uncertainty. None of the 16 held out melts is within 5.9 cation percent of anything in training.
04Trust nothing yet, including my own notes
What I was thinking: My brief has numbers in it I got from reading. Before building on them, check them against the raw sources. And if my pipeline cannot reproduce published numbers on published inputs, nothing it says about the Moon means anything.
Three numbers in my own brief did not survive:
Right number, but calculated by a redox model, not measured. So both sides of the comparison are model outputs, and I say so.
I had read that only 50 measurements have Moon-like reduced iron. The database has 375. Same conclusion, stronger: only one composition has reduced iron near the glass transition.
Two simulants in a published table carry misprinted fit parameters, off from the paper’s own data by 0.7 to 1.1 orders of magnitude. Refitting lands within 1 K of the printed glass transition.
Then the pipeline had to reproduce the papers:
0.002
median gap to the published baseline scores, log units
±0.01
on the published iron oxidation state
0.012
median gap to published Sehlke and Whittington scores, fully molten
The fine print
One piece is approximated: Sehlke and Whittington needs a reference temperature from a 1987 heat capacity model I could not get, so I fitted a substitute to the 36 published values. It is good to about 11 K, and it is listed as a limitation.
05The scorecard, where my model loses
What I was thinking: gpvisc trained on about twice my data. Beating it on accuracy was never the point. Report it straight anyway.
Error on the 16 held out simulants, in log units of viscosity (RMSE when molten, mean absolute error at the glass transition). Lower is better.
| Model | Error, 0 to 1.5 | Molten | Glass transition |
|---|---|---|---|
| Sehlke and Whittington 2016 | 0.14 | 0.87 | |
| gpvisc, pretrained | 0.17 | 0.58 | |
| My deep ensemble | 0.33 | 0.88 | |
| GRD 2008 | 0.54 | 1.38 |
Every dot jumps right: each model is about 3.5 times worse near the glass transition than fully molten. That is the sintering zone, and it is everyone’s weak spot.
06The stress test every model fails
What I was thinking: A model can score well overall and still be flat, or backwards, along the one axis I care about. So test that axis directly, against experiments where the iron state was measured, not assumed.
Seven controlled oxygen series from Chevrel’s open access thesis, none of them in my training data. This is where the quiz at the top came from.
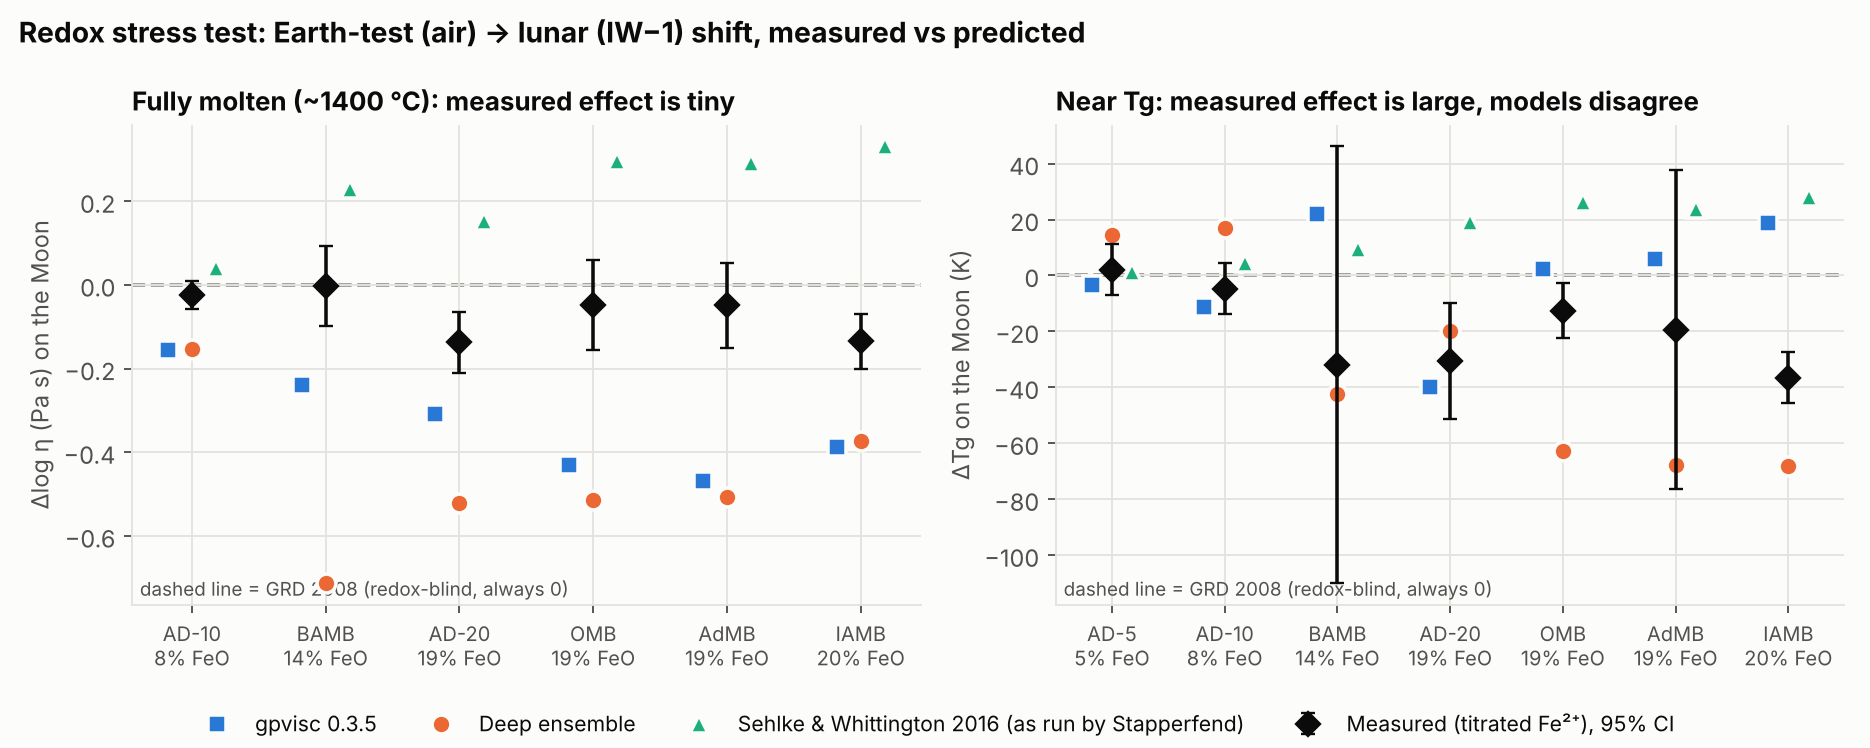
- Fully molten, the real effect is at most 0.14 log units. Every machine learning model overstates it 3 to 10 times.
- Near the glass transition, gpvisc gets the sign wrong in 5 of 7 series, despite training on those studies.
- Sehlke and Whittington, run the way the 2025 study ran it, gets the direction backwards in 12 of 13 series. I traced that to how its spreadsheet books iron oxide.
Likely cause: most Fe3+ values in the training data were calculated from temperature at air, not measured, so redox got tangled up with temperature and composition instead of learned.
07The answer, soil by soil
What I was thinking: No model passes the stress test, so do not lean on one. Anchor the shift to the measurements, and show the bracket instead of a single number.
Pick a soil and drag the temperature down. The line is an Earth test of that soil, melted in air. The shaded band is the same soil with lunar iron, using the shift fitted to the seven measured series.
1300°C
runnier on the Moon
at this same temperature, with lunar iron
cooler on the Moon
to reach this same viscosity
Across all 66 soils, the measurement anchored glass transition sits:
| Soil type | Soils | Iron (FeO) | Moon vs air melted test | Moon vs air sintered test |
|---|---|---|---|---|
| Highland | 26 | 5.8% | 1 to 7 K lower | 5 to 11 K lower |
| Mixed | 17 | 11.6% | 3 to 15 K lower | not computed |
| Mare | 23 | 16.8% | 5 to 22 K lower | 15 to 32 K lower |
At a fixed sintering temperature, iron rich mare soil is up to about 1.4 orders of magnitude runnier on the Moon. Fully molten, the shift is only 1 to 16 K, so melt processing designers can keep using air data.
The fine print
The near edge of the band assumes the effect levels off at low Fe3+; the far edge assumes it keeps going.
08The bottleneck is data, not models
What I was thinking: Every road ends at the same gap. The most useful output of this project might be the experiment someone should run next.
In every source I found, no basaltic melt has a measured viscosity or glass transition below about 12% Fe3+. The Moon is near 2%. Whether the glass transition keeps falling below 12% or levels off is worth a factor of about 4 in the predicted shift. That is the width of the band in the chart above.
The experiment I would run: melt the high titanium simulant OPRL2NT under CO and CO2 at IW−1, and measure its glass transition and viscosity below 10% Fe3+.
How I picked it
Ranking candidate experiments by how much the ensemble disagrees with itself points at the same gap: every top slot is near the glass transition, and all but one is at lunar oxygen with 10% or more FeO. Chang’e-5 soil ranks first.
09Limits, and what is next
Limits
- The shift is extrapolated from 12% to 84% Fe3+ down to the Moon’s 2%. The band covers this, but it is an assumption.
- The Earth reference matters as much as the model: a glass melted at 1500°C and a powder sintered at 1100°C start with different iron. Sintering tests should report their Fe3+.
- Metallic iron (about 0.5% in mature soils) and crystals are ignored, and real sintering is of partly crystalline powder.
- The error bars are honest on familiar chemistry (93% coverage) but overconfident on the alkali rich simulants (76%).
Next
- Add Cukierman and Uhlmann 1974, the only redox series on a real lunar composition (15555).
- Retrain without rows whose iron state was assumed from air, and see if the false temperature sensitivity goes away.
- Stretch goal, not started: search for mineral blends that land in a target viscosity window.
Sources
Training: gpvisc database, Le Losq et al. 2025. Held out: Stapperfend et al. 2025, American Mineralogist 110 and Chemical Geology 696. Redox series: Chevrel 2013, PhD thesis, LMU Munich. Soils: Zenodo 5899696. Baselines: Giordano, Russell and Dingwell 2008; Sehlke and Whittington 2016 with its 2017 corrigendum; pretrained gpvisc 0.3.5. Everyday viscosities are rough room temperature values.